During the fall of 2022, as I was attempting to explain stress states to students in my machine design class, I realized that the students were not able to mentally visualize the stress states I was describing.
Using the simple cantilevered beam model, I created a MATLAB GUI and plotter that shows the stress state in 3D plots. The solver calculates the internal stress state at a polar array of points and then graphs these as a 3D surface with the Y and Z coordinates representing physical geometry and the X coordinate representing stress acting in the X direction or shear in the YZ plane.
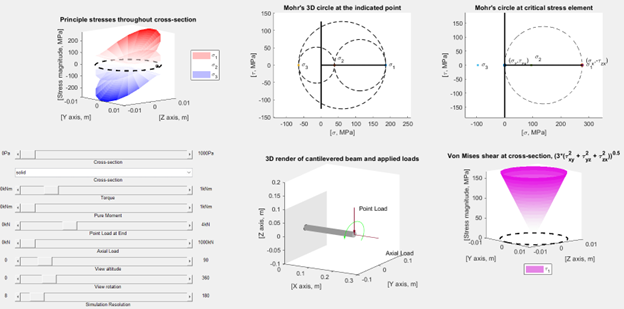
The solver allows users to adjust the types of applied loads, see the relative magnitude of those loads on a rendered cantilevered beam, and then see the calculated stress state at the point of maximum stress. To illustrate how Mohr’s circle works, the 3D Mohr’s circle is also plotted for the point of maximum stress and an arbitrary point elsewhere in the cross-section.
The GUI serves several purposes.
- It shows the conditions that lead to the use of either the 2D or 3D Mohr’s circle and why at the point of critical stress the stress state collapses from 3D to 2D.
- It shows how the von Mises stress is fundamentally different from the Mohr’s circle stress and is not useful for compression analysis.
- It demonstrates how the interaction between different forces affects the interior but that regardless of how these interact, the point of maximum stress is almost always determined by bending loads.
Encrypted MATLAB code is available upon request.

Leave a comment